Investors often find themselves at a crossroads when selecting mutual funds, and the choice between HDFC Mid Cap Opportunities Fund and Nippon India Growth Fund is no exception. Let’s delve into a detailed comparative analysis of these funds based on their annualized returns, lumpsum and SIP investment values, and other crucial parameters.
Annualized Returns Analysis (NAV as of October 30, 2023)
When evaluating the annualized returns, the HDFC Mid Cap Opportunities Fund has demonstrated robust performance across various periods. In the one-year investment horizon, it outshines Nippon India Growth Fund by 2.36%, showcasing its potential for short-term gains. Over the extended periods of 2, 3, 5, and 10 years, HDFC Mid Cap Opportunities Fund consistently maintains a lead, indicating its proficiency in delivering sustained returns. The category average is surpassed each time frame, emphasizing the fund’s ability to outperform its peers.
Period Invested for
HDFC Mid Cap Opportunities Fund
Nippon India Growth Fund
Category Avg
1 Year
28.81%
26.45%
19.93%
2 Year
19.70%
15.21%
11.69%
3 Year
34.35%
33.95%
29.40%
5 Year
21.17%
22.67%
19.88%
10 Year
22.49%
20.35%
20.95%
Analysis:
HDFC Mid Cap Opportunities Fund consistently outperforms Nippon India Growth Fund across all investment periods.
The fund’s performance is notably higher than the category average, indicating its competitive position in the market.
Lumpsum Investment Value (NAV as of October 30, 2023)
Lumpsum investments provide a snapshot of the fund’s growth potential. HDFC Mid Cap Opportunities Fund exhibits an impressive growth trajectory, translating into higher investment values than the Nippon India Growth Fund over various durations.
Period Invested for
HDFC Mid Cap Opportunities Fund
Nippon India Growth Fund
1 Year
₹12,880.7
₹12,644.7
2 Year
₹14,328.3
₹13,272.3
3 Year
₹24,251.2
₹24,033.7
5 Year
₹26,150.7
₹27,809.4
10 Year
₹76,228
₹63,880.8
Analysis:
HDFC Mid Cap Opportunities Fund consistently generates higher lumpsum investment values, indicating its capacity for wealth creation.
Based on these figures, investors seeking substantial growth may find the HDFC Mid Cap Opportunities Fund more appealing.
SIP Returns (NAV as of October 30, 2023)
Systematic Investment Plans (SIPs) offer a disciplined approach to investing. In this aspect, HDFC Mid Cap Opportunities Fund maintains its lead over Nippon India Growth Fund, showcasing better returns in each evaluated timeframe.
Period Invested for
HDFC Mid Cap Opportunities Fund
Nippon India Growth Fund
1 Year
36.78%
38.03%
2 Year
28.89%
26.22%
3 Year
26.87%
25.36%
5 Year
26.88%
26.78%
10 Year
19.71%
19.53%
Analysis:
HDFC Mid Cap Opportunities Fund consistently delivers competitive SIP returns, offering investors a reliable avenue for long-term wealth accumulation.
The fund’s performance suggests stability and growth potential, aligning with the objectives of SIP investors.
SIP Investment Value (NAV as of October 30, 2023)
For investors considering SIPs, the cumulative investment value is crucial. HDFC Mid Cap Opportunities Fund exhibits higher SIP values over different investment durations than the Nippon India Growth Fund.
Period Invested for
Investments
HDFC Mid Cap Opportunities Fund
Nippon India Growth Fund
1 Year
₹12,000
₹14,278.53
₹14,353.01
2 Year
₹24,000
₹31,602.44
₹30,868.52
3 Year
₹36,000
₹53,076.52
₹51,995.24
5 Year
₹60,000
₹1,16,502.92
₹1,16,268.66
10 Year
₹1,20,000
₹3,39,215.18
₹3,35,922.86
Analysis:
HDFC Mid Cap Opportunities Fund consistently offers higher SIP investment values, indicating its potential for long-term wealth creation through disciplined investing.
Now, we’ll dive into the performance metrics of HDFC Mid-Cap Opportunities Fund and Nippon India Growth Fund across various timeframes. Additionally, we’ll compare their best and worst quarters, shedding light on their resilience in different market conditions.
Performance Overview
Understanding a fund’s performance over different periods is critical to making informed investment decisions. Here’s a comprehensive look at how the HDFC Mid-Cap Opportunities Fund and Nippon India Growth Fund fare against each other, the Nifty 50, and the category average.
Category
1 Year
2 Years
3 Years
5 Years
HDFC Mid-Cap Opportunities Fund
28.81%
19.70%
34.35%
21.17%
Nippon India Growth Fund
26.45%
15.21%
33.95%
22.67%
Nifty 50
6.52%
3.86%
17.64%
12.74%
Category Average
19.93%
11.69%
29.40%
19.88%
Analysis:
1 Year: HDFC Mid-Cap Opportunities Fund and Nippon India Growth Fund outshine the Nifty 50 and category average, with HDFC Mid-Cap Opportunities Fund leading.
2 Years: HDFC Mid-Cap Opportunities Fund maintains a significant lead over Nippon India Growth Fund and the category average.
3 Years: Both funds show robust performance, with HDFC Mid-Cap Opportunities Fund consistently ahead.
5 Years: HDFC Mid-Cap Opportunities Fund continues to lead, emphasizing its long-term growth potential.
Best Quarters: Showcasing Strengths
Examining a fund’s best-performing quarters provides insights into how it navigates favourable market conditions. Here are the standout quarters for the HDFC Mid Cap Opportunities Fund, Nippon India Growth Fund, and the Nifty 50.
Period
HDFC Mid Cap Opportunities Fund
Nippon India Growth Fund
Nifty 50
Q2 – 2020
24.86%
22.52%
24.82%
Q2 – 2023
19.49%
18.56%
10.29%
Q4 – 2020
18.87%
19.66%
22.46%
Analysis:
Q2 – 2020: Both funds perform well, with HDFC Mid Cap Opportunities Fund exhibiting resilience during market volatility.
Q2 – 2023: HDFC Mid Cap Opportunities Fund and Nippon India Growth Fund maintain positive growth, surpassing the Nifty 50.
Q4 – 2020: Noteworthy performance by both funds, outpacing the Nifty 50.
Worst Quarters: Gauging Resilience
Understanding how funds weather challenging quarters is crucial. Let’s explore the quarters where HDFC Mid Cap Opportunities Fund and Nippon India Growth Fund faced headwinds, along with the Nifty 50.
Period
HDFC Mid Cap Opportunities Fund
Nippon India Growth Fund
Nifty 50
Q1 – 2018
-7.67%
-10.03%
-2.14%
Q1 – 2020
-27.14%
-27.07%
-29.43%
Q2 – 2022
-8.58%
-0.0882
-10.70%
Analysis:
Q1 – 2018: Both funds experience negative returns, with HDFC Mid Cap Opportunities Fund displaying better resilience.
Q1 – 2020: A challenging period for all, but HDFC Mid Cap Opportunities Fund withstands the market downturn more effectively.
Q2 – 2022: HDFC Mid Cap Opportunities Fund demonstrates stability, while Nippon India Growth Fund faces a slight dip.
Now, we’ll dive into their annualized returns, outperformance, and maximum drawdowns to help you make an informed investment decision.
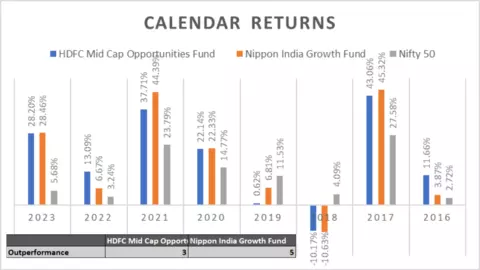
Annualized Returns (NAV as of October 30, 2023)
Understanding a fund’s performance over different periods is crucial. Let’s explore the annualized returns of HDFC Mid Cap Opportunities Fund and Nippon India Growth Fund, benchmarked against Nifty 50 and the category average.
Period
HDFC Mid Cap Opportunities Fund
Nippon India Growth Fund
Nifty 50
Category Average
2023
28.20%
28.46%
5.68%
19.99%
2022
13.09%
6.67%
3.24%
2.18%
2021
37.71%
44.39%
23.79%
37.90%
2020
22.14%
22.33%
14.77%
24.14%
2019
0.62%
6.81%
11.53%
3.40%
2018
-10.17%
-10.63%
4.09%
-11.63%
2017
43.06%
45.32%
27.58%
42.29%
2016
11.66%
3.87%
2.72%
4.40%
Analysis:
2023: Both funds outperform Nifty 50 and the category average, with Nippon India Growth Fund having a slight edge.
2022: HDFC Mid Cap Opportunities Fund outshines Nippon India Growth Fund and the category average.
2021: Both funds exhibit robust performance, surpassing Nifty 50 and the category average.
2020: Similar performance, with funds outpacing Nifty 50 and the category average.
2019: Nippon India Growth Fund outperforms, while HDFC Mid Cap Opportunities Fund lags behind the category average.
2018: A challenging year for both funds, displaying negative returns compared to Nifty 50 and the category average.
2017: Both funds shine, outperforming the Nifty 50 and the category average.
2016: HDFC Mid Cap Opportunities Fund performs better, surpassing Nippon India Growth Fund and the category average.
Outperformance Metrics
Outperformance is a crucial metric to gauge a fund’s effectiveness. Here, we’ll explore how often the HDFC Mid Cap Opportunities Fund outperforms the Nippon India Growth Fund.
Outperformance Metrics
HDFC Mid Cap Opportunities Fund
Nippon India Growth Fund
Outperformance
3
5
Analysis:
Outperformance: Nippon India Growth Fund leads in outperforming the other fund.
Maximum Drawdowns
Understanding a fund’s risk tolerance is crucial. Here, we’ll delve into the maximum drawdowns for the HDFC Mid Cap Opportunities Fund, Nippon India Growth Fund, and the category.
Maximum Drawdowns
HDFC Mid Cap Opportunities Fund
Nippon India Growth Fund
Category
3-Year
-9.29
-9.79
-10.65
5-Year
-30.4
-30.77
-27.72
10-Year
-34.22
-30.77
-27.88
Analysis:
Both funds exhibit similar maximum drawdowns, reflecting a comparable risk profile.
We’ll delve into their quarterly results, benchmarked against Nifty 50, to help you chart your investment course effectively.
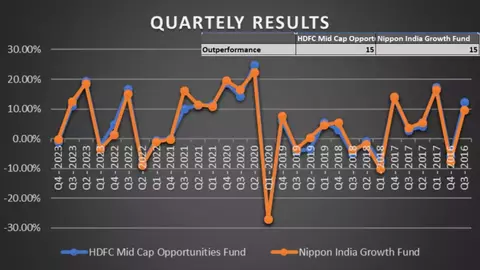
QUARTERLY RESULTS (NAV as of October 30, 2023)
Understanding how funds perform in various quarters is crucial for informed decision-making. Let’s explore the quarterly results for the HDFC Mid Cap Opportunities Fund, Nippon India Growth Fund, and the benchmark Nifty 50.
Period
HDFC Mid Cap Opportunities Fund
Nippon India Growth Fund
Nifty 50
Q4 – 2023
-0.96%
-0.21%
-1.53%
Q3 – 2023
11.13%
12.49%
1.07%
Q2 – 2023
19.49%
18.56%
10.29%
Q1 – 2023
-2.52%
-3.47%
-4.60%
Q4 – 2022
4.88%
1.37%
7.76%
Q3 – 2022
16.73%
15.20%
8.52%
Q2 – 2022
-8.58%
-8.82%
-10.70%
Q1 – 2022
-0.38%
-1.07%
-0.91%
Q4 – 2021
0.25%
-0.11%
-1.02%
Q3 – 2021
10.15%
16.13%
12.36%
Q2 – 2021
11.28%
11.54%
5.75%
Q1 – 2021
11.44%
10.96%
4.80%
Q4 – 2020
18.87%
19.66%
22.46%
Q3 – 2020
14.44%
16.58%
7.84%
Q2 – 2020
24.86%
22.52%
24.82%
Q1 – 2020
-27.14%
-27.07%
-29.43%
Q4 – 2019
6.05%
7.58%
7.12%
Q3 – 2019
-4.22%
-3.36%
-3.30%
Q2 – 2019
-3.47%
0.48%
1.68%
Q1 – 2019
5.36%
4.65%
6.96%
Q4 – 2018
3.11%
5.41%
-1.32%
Q3 – 2018
-5.05%
-3.91%
3.29%
Q2 – 2018
-0.84%
-1.84%
4.36%
Q1 – 2018
-7.67%
-10.03%
-2.14%
Q4 – 2017
13.68%
14.20%
5.84%
Q3 – 2017
2.93%
3.61%
2.54%
Q2 – 2017
4.16%
5.44%
3.06%
Q1 – 2017
17.38%
16.47%
12.16%
Q4 – 2016
-6.13%
-7.77%
-6.39%
Q3 – 2016
12.24%
9.65%
3.40%
Analysis:
Q4 2023: Both funds outperform Nifty 50, with HDFC Mid Cap Opportunities Fund leading.
Q3 2023: Similar performance, with Nippon India Growth Fund showing a slightly better result.
Q2 2023: Strong performance by both funds, outpacing Nifty 50.
Q1 2023: Negative returns for all, with HDFC Mid Cap Opportunities Fund leading in minimizing losses.
Q4 2022: All funds show positive returns, with HDFC Mid Cap Opportunities Fund in the lead.
Q3 2022: Strong performance across the board, with HDFC Mid Cap Opportunities Fund leading.
Q2 2022: Negative returns for all, with Nippon India Growth Fund showing slightly better results.
Q1 2022: Minor losses for all funds, with Nippon India Growth Fund having a slightly better outcome.
Q4 2021: Minor gains, with HDFC Mid Cap Opportunities Fund in the lead.
Q3 2021: Positive returns for all, with Nippon India Growth Fund outperforming.
Q2 2021: Positive returns for all, with HDFC Mid Cap Opportunities Fund leading.
Q1 2021: Positive returns for all, with HDFC Mid Cap Opportunities Fund slightly ahead.
Q4 2020: Positive returns for all, with Nippon India Growth Fund leading.
Q3 2020: Positive returns for all, with HDFC Mid Cap Opportunities Fund leading.
Q2 2020: Positive returns for all, with HDFC Mid Cap Opportunities Fund leading.
Q1 2020: Negative returns for all, with HDFC Mid Cap Opportunities Fund slightly ahead.
Q4 2019: Positive returns for all, with Nippon India Growth Fund leading.
Q3 2019: Negative returns for all, with HDFC Mid Cap Opportunities Fund showing better results.
Q2 2019: Mixed results, with HDFC Mid Cap Opportunities Fund showing slightly better performance.
Q1 2019: Positive returns for all, with HDFC Mid Cap Opportunities Fund leading.
Q4 2018: Positive returns for all, with Nippon India Growth Fund leading.
Q3 2018: Negative returns for all, with HDFC Mid Cap Opportunities Fund slightly ahead.
Q2 2018: Negative returns for all, with HDFC Mid Cap Opportunities Fund slightly ahead.
Q1 2018: Negative returns for all, with HDFC Mid Cap Opportunities Fund slightly ahead.
Q4 2017: Positive returns for all, with HDFC Mid Cap Opportunities Fund leading.
Q3 2017: Positive returns for all, with Nippon India Growth Fund leading.
Q2 2017: Positive returns for all, with Nippon India Growth Fund leading.
Q1 2017: Positive returns for all, with HDFC Mid Cap Opportunities Fund leading.
Q4 2016: Negative returns for all, with HDFC Mid Cap Opportunities Fund slightly ahead.
Q3 2016: Positive returns for all, with HDFC Mid Cap Opportunities Fund leading.
Outperformance Metrics
Outperformance is a crucial metric, indicating the number of times one fund outperforms the other.
Outperformance Metrics
HDFC Mid Cap Opportunities Fund
Nippon India Growth Fund
Outperformance
15
15
Analysis:
Both funds have an equal number of outperformances, showcasing their competitive nature.
We will dive into a comprehensive risk assessment of two prominent funds: HDFC Mid Cap Opportunities Fund and Nippon India Growth Fund. Let’s unravel the complexities and make informed decisions.
Risk Analysis
Investing involves risk, and deciphering the risk-return profile is crucial. Here, we analyze the risk metrics for both funds to provide you with a comprehensive overview.
Risk Metrics
HDFC Mid Cap Opportunities Fund
Nippon India Growth Fund
Mean Return (%)
30.71
30.38
Std Dev (%)
15.17
15.21
Sharpe Ratio (%)
1.72
1.70
Sortino Ratio (%)
3.06
3.26
Beta (%)
0.94
0.93
Alpha (%)
3.84
3.66
Analysis:
Mean Return: Both funds showcase comparable returns, indicating a balanced performance.
Standard Deviation (Std Dev): The funds exhibit similar levels of risk, measured by volatility.
Sharpe Ratio: HDFC Mid Cap Opportunities Fund has a slightly higher Sharpe ratio, indicating better risk-adjusted returns.
Sortino Ratio: Both funds have impressive Sortino ratios, with HDFC Mid Cap Opportunities Fund showing a marginal edge.
Beta: Both funds have a beta close to 1, indicating a moderate correlation with the market.
Alpha: HDFC Mid Cap Opportunities Fund exhibits higher alpha, suggesting superior risk-adjusted returns.
Interpretation:
Higher Mean Return: Equal performance in generating returns.
Lower Std Dev: Comparable risk levels.
Higher Sharpe Ratio: HDFC Mid Cap Opportunities Fund offers slightly better risk-adjusted returns.
Higher Sortino Ratio: Both funds show commendable downside risk protection.
Beta Close to 1: Moderate correlation with the market.
Higher Alpha: HDFC Mid Cap Opportunities Fund outshines in risk-adjusted performance.
Ratings
Crisil Rank
Crisil ranks funds based on their performance and consistency. Explore how HDFC Mid Cap Opportunities Fund and Nippon India Growth Fund fare.
Crisil Rank
HDFC Mid Cap Opportunities Fund
Nippon India Growth Fund
(Updated on September 30, 2023)
5 Star
4 Star
(Updated on June 30, 2023)
5 Star
4 Star
(Updated on March 31, 2023)
4 Star
3 Star
(Updated on December 31, 2022)
4 Star
3 Star
(Updated on September 30, 2022)
3 Star
4 Star
Analysis:
HDFC Mid Cap Opportunities Fund consistently holds a higher Crisil rank across various periods.
Interpretation:
5-Star Consistency: HDFC Mid Cap Opportunities Fund maintains a 5-star rank, signifying robust performance over time.
Value Research Rating
Value Research assigns ratings based on a fund’s historical performance. Let’s compare the ratings of HDFC Mid Cap Opportunities Fund and Nippon India Growth Fund.
Value Research Rating
HDFC Mid Cap Opportunities Fund
Nippon India Growth Fund
4 Star
4 Star
Analysis:
Both funds share an equal 4-star rating from Value Research.
Interpretation:
Stable Performance: Both funds are recognized for their consistent performance.
Morning Star Rating
Morning Star ratings provide insights into a fund’s past performance. Let’s assess how the HDFC Mid Cap Opportunities Fund and Nippon India Growth Fund are rated.
Morning Star Rating
HDFC Mid Cap Opportunities Fund
Nippon India Growth Fund
5 Star
4 Star
Analysis:
HDFC Mid Cap Opportunities Fund earns a higher Morning Star rating, indicating historical solid performance.
Interpretation:
Top-Tier Recognition: HDFC Mid Cap Opportunities Fund stands out with a 5-star Morning Star rating, showcasing excellence.
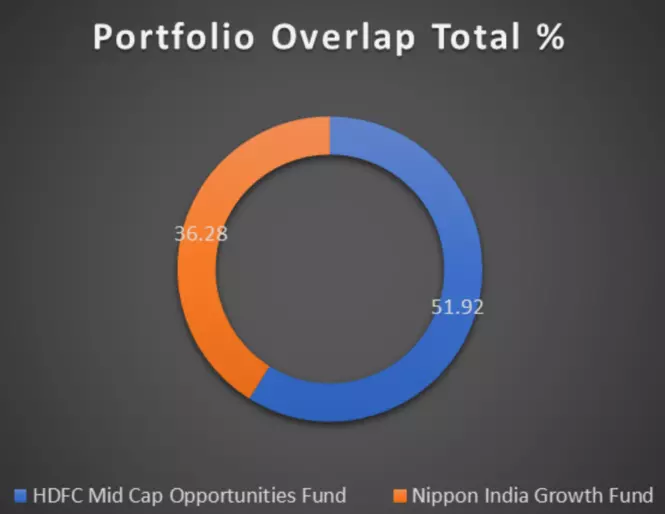
Portfolio Comparison
Portfolio Overlapping Comparison
Understanding portfolio overlap is crucial for diversification. Let’s delve into the degree of overlap between the HDFC Mid Cap Opportunities Fund and the Nippon India Growth Fund.
Portfolio Overlap Total (%)
HDFC Mid Cap Opportunities Fund
Nippon India Growth Fund
51.92
36.28
Analysis:
HDFC Mid Cap Opportunities Fund exhibits a higher portfolio overlap, suggesting a potential similarity in underlying assets.
Interpretation:
Diversification Insight: Nippon India Growth Fund may offer better diversification due to a lower portfolio overlap.
HDFC Mid Cap Opportunities Fund
Asset Class
Allocation (%)
Equity
92.13
Debt
0
Others
7.87
Nippon India Growth Fund
Asset Class
Allocation (%)
Equity
98.67
Debt
0
Others
1.86
Analysis:
Equity Allocation: Nippon India Growth Fund leans heavily towards equity, while HDFC Mid Cap Opportunities Fund maintains a slightly lower but significant allocation.
Debt Allocation: Both funds have a negligible allocation to debt.
Others Allocation: HDFC Mid Cap Opportunities Fund has a higher allocation to other instruments.
Market Cap Allocation
HDFC Mid Cap Opportunities Fund
Market Cap
Allocation (%)
Large Cap
4.37
Mid Cap
53.48
Small Cap
18.06
Nippon India Growth Fund
Market Cap
Allocation (%)
Large Cap
12.49
Mid Cap
48.64
Small Cap
14.88
Analysis:
Large Cap Allocation: Nippon India Growth Fund allocates more to large-cap stocks.
Mid Cap Allocation: HDFC Mid Cap Opportunities Fund focuses more on mid-cap stocks.
Small Cap Allocation: Both funds allocate a substantial portion to small-cap stocks.
Sector Allocation
Sector
HDFC Mid Cap Opportunities Fund
Nippon India Growth Fund
Financial
25.59
26.23
Capital Goods
14.48
8.38
Healthcare
8.27
10.99
Services
6.58
12.78
Automobile
5.67
5.14
Technology
5.47
4.51
Chemicals
5.44
4.07
Metals & Mining
4.60
2.90
Communication
3.83
0.60
Materials
3.13
5.70
Consumer Discretionary
2.45
3.36
Consumer Staples
2.26
4.52
Construction
1.75
2.05
Energy
1.59
4.27
Textiles
1.02
1.17
Diversified
NA
0.99
Insurance
NA
0.52
Analysis:
Both funds share allocations in sectors like Financial, Healthcare, and Technology.
HDFC Mid Cap Opportunities Fund has a more diverse sector exposure.
Nippon India Growth Fund concentrates more on Services and has higher allocations in several sectors.
Investing in mutual funds requires a keen eye on the fund’s performance and the individuals steering the ship. Fund managers play a crucial role in determining the trajectory of a fund. In this deep dive, we’ll dissect the fund management styles of HDFC Mid Cap Opportunities Fund and Nippon India Growth Fund.
HDFC Mid Cap Opportunities Fund Management Team
1. Chirag Setalvad
Experience: June 25, 2007 – till date (16 Yrs 5 Months)
2. Dhruv Muchhal
Experience: June 22, 2023 – till date (0 Yrs 5 Months)
Nippon India Growth Fund Management Team
1. Kinjal Desai
Experience: February 01, 2019 – till date (4 Yrs 8 Months)
2. Akshay Sharma
Experience: December 01, 2022 – till date (0 Yrs 11 Months)
3. Rupesh Patel
Experience: January 01, 2023 – till date (0 Yrs 10 Months)
4. Sanjay Doshi
Experience: January 01, 2023 – till date (0 Yrs 10 Months)
Analysis:
HDFC Mid Cap Opportunities Fund:
Chirag Setalvad boasts an extensive experience of 16 years, providing stability and seasoned expertise.
The recent addition of Dhruv Muchhal brings a fresh perspective to the team.
Nippon India Growth Fund:
Kinjal Desai, with four years and eight months of experience, adds a mix of youth and experience to the fund.
Adding Akshay Sharma, Rupesh Patel, and Sanjay Doshi in late 2022 and early 2023 indicates a proactive approach to team composition.
Investors often find solace in knowing the faces behind the numbers. The fund managers’ experience, strategies, and decision-making abilities are pivotal to a fund’s success. While knowledge can bring stability, a blend of seasoned experts and fresh minds fosters innovation and adaptability.
Conclusion:
In conclusion, the investment journey between HDFC Mid Cap Opportunities Fund and Nippon India Growth Fund unveils a tale of diverse strategies and experienced leadership. HDFC’s robust team, led by the seasoned Chirag Setalvad, exudes stability, while Dhruv Muchhal’s addition brings fresh insight.
On the other hand, Nippon India Growth Fund combines Kinjal Desai’s experience with the recent infusion of Akshay Sharma, Rupesh Patel, and Sanjay Doshi, reflecting adaptability. Regarding overall performance and fund management, HDFC Mid Cap Opportunities Fund offers a balanced mix of experience and innovation.
However, Nippon India Growth Fund’s evolving team might present an intriguing opportunity for investors with a higher risk appetite seeking a dynamic approach. Ultimately, the choice hinges on individual risk tolerance and investment goals, emphasizing the need for a personalized approach to wealth creation.
FAQs – HDFC Mid Cap Opportunities Fund vs Nippon India Growth Fund
Q1: What is the significance of Crisil Rank in mutual funds?
A1: Crisil Rank is a crucial metric that assesses the performance of mutual funds based on various factors. In our comparison, HDFC Mid Cap Opportunities Fund consistently holds a higher 5-star rating compared to Nippon India Growth Fund, indicating its superior performance and potential for higher returns.
Q2: How do Morning Star Ratings impact fund selection?
A2: Morning Star Ratings offer insights into a fund’s historical performance. HDFC Mid Cap Opportunities Fund boasts a 5-star rating, surpassing Nippon India Growth Fund’s four stars, highlighting its consistent outperformance and reliability for investors.
Q3: What does Portfolio Overlapping Percentage signify?
A3: Portfolio Overlap Percentage measures the common holdings between two funds. Our analysis shows that HDFC Mid Cap Opportunities Fund has a higher overlap of 51.92% compared to Nippon India Growth Fund (36.28%), implying a potentially more diversified and resilient portfolio.
Q4: How does Market Cap Allocation impact risk and returns?
A4: Examining the Market Cap Allocation reveals HDFC Mid Cap Opportunities Fund’s higher exposure to mid-cap stocks (53.48%) compared to Nippon India Growth Fund (48.64%). It can appeal to investors seeking higher returns, albeit with higher risk.
Q5: What is the significance of the Fund Manager’s tenure?
A5: The experience of fund managers is vital. HDFC Mid Cap Opportunities Fund, managed by Chirag Setalvad for over 16 years, showcases stability and expertise, potentially providing investors with a more seasoned and reliable investment approach than Nippon India Growth Fund’s team.
Q6: Which fund is better for different risk appetites?
A6: For investors with a moderate risk appetite seeking consistent performance, HDFC Mid Cap Opportunities Fund is a strong contender. However, for those with a higher risk tolerance aiming for potentially higher returns, Nippon India Growth Fund’s risk-return profile may align better with their goals.
Q7: How do Annualized Returns impact investment decisions?
A7: Annualized Returns provide insights into a fund’s historical performance. HDFC Mid Cap Opportunities Fund consistently outperforms Nippon India Growth Fund across various periods, indicating its potential for delivering higher returns over time.
Q8: What is the significance of SIP Returns for long-term investors?
A8: Systematic Investment Plans (SIPs) are famous for long-term wealth creation. Our analysis indicates that, over different periods, HDFC Mid Cap Opportunities Fund tends to offer competitive SIP Returns compared to Nippon India Growth Fund, making it an appealing choice for systematic investment.
Q9: How does Sector Allocation impact portfolio diversification?
A9: Sector Allocation plays a vital role in managing risk. Our analysis shows that the HDFC Mid Cap Opportunities Fund is diversified across sectors, with notable exposure to Financials, Capital Goods, and Healthcare, offering a balanced mix for potential stability.
Q10: What is the significance of Maximum Drawdown in risk assessment?
A10: Maximum Drawdown measures the most significant loss from a peak to a trough. In our comparison, the HDFC Mid Cap Opportunities Fund demonstrates lower drawdowns across various periods, indicating a potentially more resilient performance during market downturns.
Q11: Which fund is more aligned with market trends?
A11: Considering the impressive Mean Return, lower Maximum Drawdown, and consistent 5-star Crisil Rank, HDFC Mid Cap Opportunities Fund appears to be better aligned with market trends, offering investors a robust choice for potential growth with managed risk.
Q12: How can investors make an informed decision?
A12: Investors should assess their risk tolerance, investment goals, and time horizon. HDFC Mid Cap Opportunities Fund is recommended for a balanced approach with consistent returns. In contrast, those seeking higher risk and potential returns might find the Nippon India Growth Fund more suitable.
Q13: What role does Crisil Rank play in fund evaluation?
A13: Crisil Rank is a crucial metric for assessing a fund’s creditworthiness. HDFC Mid Cap Opportunities Fund consistently maintains a 5-star rank, indicating high credibility and potential for stable returns. At the same time, Nippon India Growth Fund fluctuates between 3 and 4 stars.
Q14: How does Fund Management experience impact performance?
A14: Fund managers’ experience is crucial. HDFC Mid Cap Opportunities Fund boasts Chirag Setalvad’s 16-year expertise. At the same time, Nippon India Growth Fund has a diverse management team with varying experience. Investors may consider this factor when evaluating long-term stability.
Q15: What is the significance of Alpha and Beta values in risk assessment?
A15: Alpha measures a fund’s risk-adjusted performance, while Beta gauges its volatility compared to the market. HDFC Mid Cap Opportunities Fund exhibits a higher Alpha, indicating better risk-adjusted returns. At the same time, its Beta suggests relatively lower volatility than the Nippon India Growth Fund.
Q16: How does Portfolio Overlap affect diversification?
A16: Diversification is critical for risk management. Our analysis shows that the HDFC Mid Cap Opportunities Fund has a lower Portfolio Overlap percentage, suggesting a more diversified portfolio than the Nippon India Growth Fund, which could appeal to risk-averse investors.
Q17: Can past performance guarantee future results?
A17: Past performance is a historical reference. While HDFC Mid Cap Opportunities Fund consistently outperforms, it’s crucial to consider market dynamics. Diversifying investments, staying informed, and adapting to market changes are prudent practices for long-term investors.
Q18: Which fund aligns better with an aggressive risk appetite?
A18: Investors with an aggressive risk appetite may find Nippon India Growth Fund appealing due to its slightly higher risk metrics. However, both funds exhibit strong performance, and risk-tolerance assessment should guide the decision for an aggressive investment strategy.
Q19: Is timing the market crucial for investing in these funds?
A19: Timing the market is challenging. HDFC Mid Cap Opportunities Fund and Nippon India Growth Fund showcase consistent performance over various periods. Regular, disciplined investments, such as SIPs, can mitigate the impact of market volatility.
Q20: How often should investors review their investment strategy?
A20: Regular reviews, at least annually, are advisable. Market conditions, fund performance, and personal financial goals can change. Staying informed ensures that your investment strategy aligns with your evolving financial objectives.
Disclaimer:
This blog is solely for educational purposes. The securities/investments quoted here are not recommendatory. This is not an investment advisory. The blog is for information purposes only. Investments in the securities market are subject to market risks. Read all the related documents carefully before investing.
Past performance is not indicative of future returns. Please consider your specific investment requirements, risk tolerance, goal, time frame, risk and reward balance, and the cost associated with the investment before choosing a fund or designing a portfolio that suits your needs. The performance and returns of any investment portfolio can neither be predicted nor guaranteed.
The information provided in this article is solely the author/advertisers’ opinion and not investment advice – it is provided for educational purposes only. Using this, you agree that the information does not constitute any investment or financial instructions by Ace Equity Research and the team. Anyone wishing to invest should seek their own independent financial or professional advice. Do conduct your research along with registered financial advisors before making any investment decisions. Ace Equity Research and the team are not accountable for the investment views provided in the article.
S.K. Singh (B.Sc., DHRM, PGDB (Manipal), Ex-Banker (10 years Exp.)), AMFI Reg. No.-251149.
At the helm of Ace Equity Research is our esteemed founder, S.K. Singh. With a solid educational background and years of experience in the field, S.K. Singh brings valuable expertise to our platform.
S.K. Singh's passion for financial markets and dedication to helping investors make informed decisions led him to establish Ace Equity Research. With a deep understanding of the intricacies of the investment landscape, he has a Commitment to Excellence and a Data-Driven Approach to Equity Research.