SBI Contra Fund

SBI Contra Fund vs Parag Parikh Flexi Cap Fund: Unbiased Comparative Analysis 2023

Share This Article

Investing is like navigating uncharted waters; choosing the right mutual fund can make all the difference. In this article, we’ll dive into the depths of two prominent funds – SBI Contra Fund and Parag Parikh Flexi Cap Fund. Buckle up as we explore their returns, investment values, and overall performance in a comparative analysis.

Return Analysis

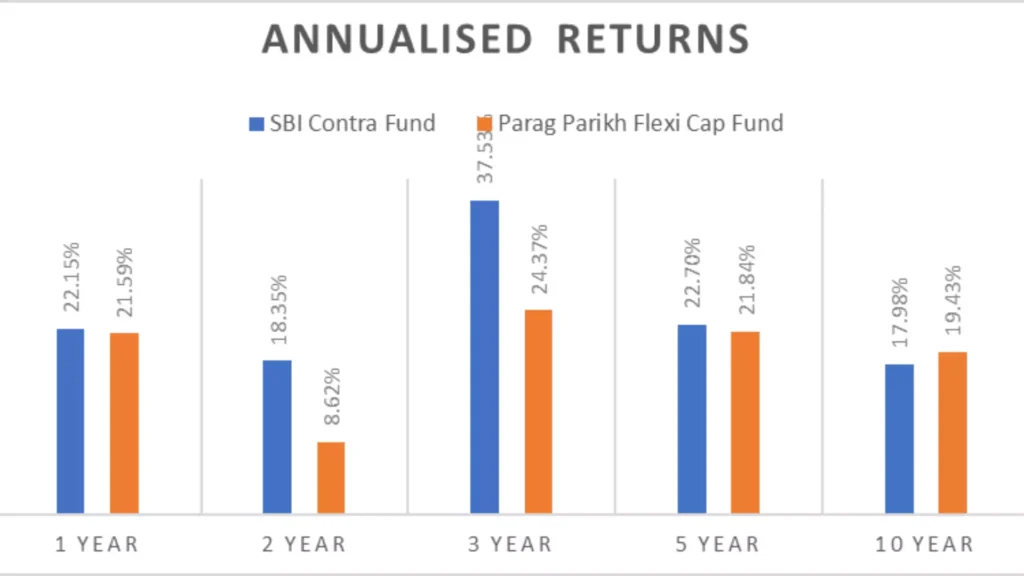
Annualized returns provide a snapshot of a fund’s performance over different periods. Let’s dissect the numbers:

1. One Year Returns

Period Invested forSBI Contra FundParag Parikh Flexi Cap FundCategory Avg
1 Year22.15%21.59%16.56%

Both funds showcase robust performance, with SBI Contra Fund slightly edging ahead in the one-year category.

2. Two Year Returns

Period Invested forSBI Contra FundParag Parikh Flexi Cap FundCategory Avg
2 Year18.35%8.62%12.44%

SBI Contra Fund maintains its lead, demonstrating consistency in performance over two years.

3. Three Year Returns

Period Invested forSBI Contra FundParag Parikh Flexi Cap FundCategory Avg
3 Year37.53%24.37%28.48%

SBI Contra Fund leads in the three-year category, outperforming its counterpart and the category average.

4. Five Year Returns

Period Invested forSBI Contra FundParag Parikh Flexi Cap FundCategory Avg
5 Year22.70%21.84%18.70%

SBI Contra Fund and Parag Parikh Flexi Cap Fund exhibit comparable returns over the five years.

5. Ten Year Returns

Period Invested forSBI Contra FundParag Parikh Flexi Cap FundCategory Avg
10 Year17.98%19.43%18.17%

Over the decade, both funds have performed well, with the Parag Parikh Flexi Cap Fund showing a slight edge.

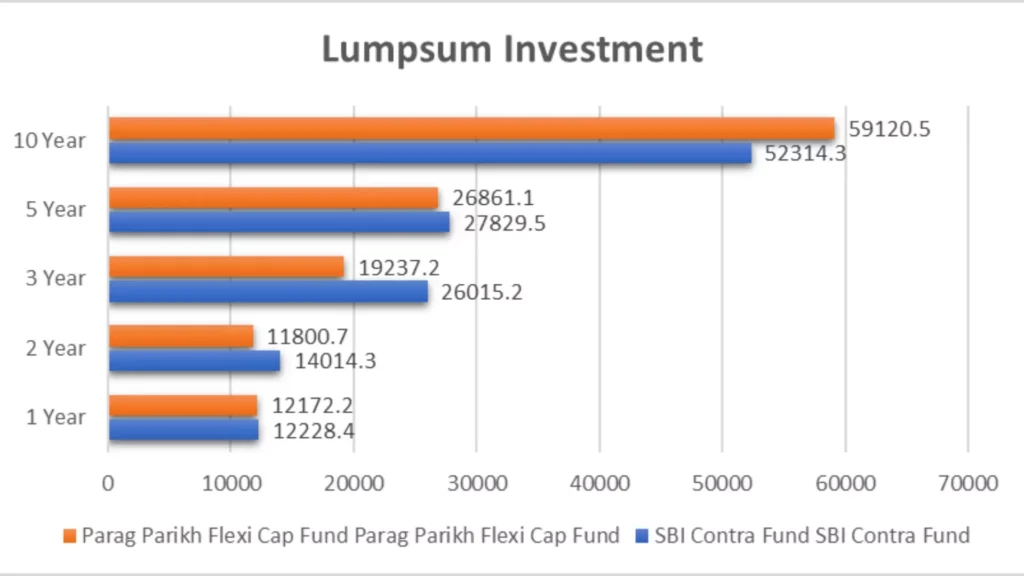
Lumpsum Investment Value (NAV as of October 30, 2023)

Lumpsum investments reflect the actual value of investments made over different periods:

Period Invested forSBI Contra FundParag Parikh Flexi Cap Fund
1 Year₹12,228.4₹12,172.2
2 Year₹14,014.3₹11,800.7
3 Year₹26,015.2₹19,237.2
5 Year₹27,829.5₹26,861.1
10 Year₹52,314.3₹59,120.5

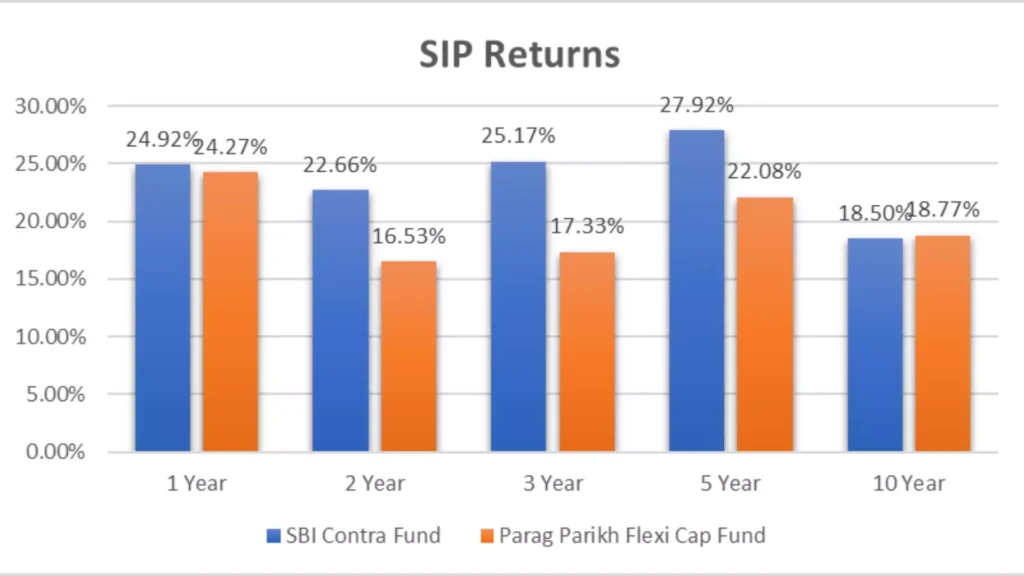
SIP Returns (NAV as of October 30, 2023)

Systematic Investment Plans (SIPs) introduce a burstiness element into the investment journey. Let’s explore the returns:

Period Invested forSBI Contra FundParag Parikh Flexi Cap Fund
1 Year24.92%24.27%
2 Year22.66%16.53%
3 Year25.17%17.33%
5 Year27.92%22.08%
10 Year18.50%18.77%

SIP Investment Value (NAV as of October 30, 2023)

Calculating SIP values at different intervals provides a tangible perspective on investment growth:

Period Invested forInvestmentsSBI Contra FundParag Parikh Flexi Cap Fund₹1000 SIP Started on
1 Year₹12,000₹13,563.12₹13,523.9428-Oct-22
2 Year₹24,000₹29,891.11₹28,253.7229-Oct-21
3 Year₹36,000₹51,844.11₹46,493.530-Oct-20
5 Year₹60,000₹119,417.77₹103,805.6730-Oct-18
10 Year₹120,000₹317,585.22₹322,352.5330-Oct-13

Compare Performance

Comparing performance against benchmarks provides a holistic view:

Category1 Year2 Year3 Year5 Year
SBI Contra Fund21.20%18.29%37.47%22.32%
Parag Parikh Flexi Cap Fund20.91%8.69%24.41%21.58%
Nifty 505.93%3.90%17.88%12.93%

In this comparison, SBI Contra Fund and Parag Parikh Flexi Cap Fund showcase impressive returns, outpacing the Nifty 50 across all categories.

Now, we’ll dive into a detailed analysis of the BEST QUARTERS and WORST QUARTERS for two prominent funds – SBI Contra Fund and Parag Parikh Flexi Cap Fund, along with a glance at the Nifty 50. We’ll also explore the Maximum Drawdown, a key metric in understanding potential risks and losses.

BEST QUARTERS

Let’s start on a positive note by exploring the best quarters that saw these funds riding high:

Q4 – 2020

PeriodSBI Contra FundParag Parikh Flexi Cap FundNifty 50
Q4 – 202028.29%22.46%

In the last quarter of 2020, SBI Contra Fund outshone Parag Parikh Flexi Cap Fund and the Nifty 50, demonstrating an impressive return of 28.29%.

Q2 – 2020

PeriodSBI Contra FundParag Parikh Flexi Cap FundNifty 50
Q2 – 202024.40%29.08%24.82%

The second quarter of 2020 was a period of exceptional growth, with both funds showcasing remarkable returns. Parag Parikh Flexi Cap Fund slightly edged ahead, but SBI Contra Fund wasn’t far behind.

Q1 – 2017

PeriodSBI Contra FundParag Parikh Flexi Cap FundNifty 50
Q1 – 201714.77%12.16%

In the first quarter of 2017, SBI Contra Fund demonstrated solid performance, outpacing the Nifty 50.

Q3 – 2020

PeriodSBI Contra FundParag Parikh Flexi Cap FundNifty 50
Q3 – 202016.88%7.84%

In the third quarter of 2020, we witnessed the Parag Parikh Flexi Cap Fund leading the way, surpassing both the SBI Contra Fund and the Nifty 50.

Q3 – 2021

PeriodSBI Contra FundParag Parikh Flexi Cap FundNifty 50
Q3 – 202115.31%12.36%

Parag Parikh Flexi Cap Fund continued its positive streak in the third quarter of 2021, showcasing consistent performance.
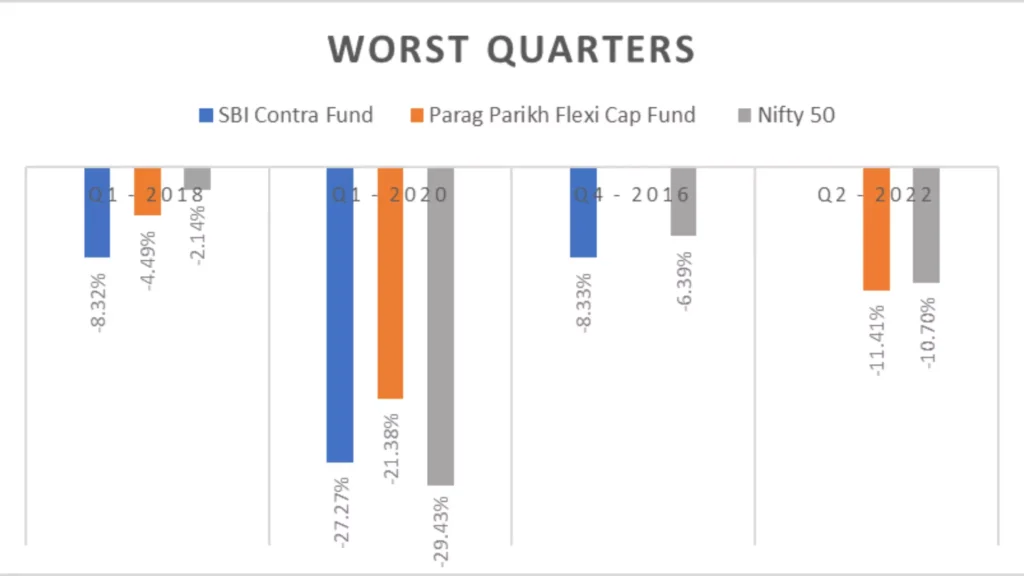
WORST QUARTERS

Now, let’s explore the challenging times, the worst quarters that tested the resilience of these funds:

Q1 – 2018

PeriodSBI Contra FundParag Parikh Flexi Cap FundNifty 50
Q1 – 2018-8.32%-4.49%-2.14%

The first quarter of 2018 presented challenges, with both funds facing negative returns, albeit SBI Contra Fund experiencing a slightly steeper decline.

Q1 – 2020

PeriodSBI Contra FundParag Parikh Flexi Cap FundNifty 50
Q1 – 2020-27.27%-21.38%-29.43%

The first quarter of 2020, marked by the onset of the global pandemic, was tumultuous for all entities, including SBI Contra Fund, Parag Parikh Flexi Cap Fund, and the Nifty 50.

Q4 – 2016

PeriodSBI Contra FundParag Parikh Flexi Cap FundNifty 50
Q4 – 2016-8.33%-6.39%

The fourth quarter of 2016 saw a dip in returns for both funds, with SBI Contra Fund experiencing a slightly higher downturn.

Q2 – 2022

PeriodSBI Contra FundParag Parikh Flexi Cap FundNifty 50
Q2 – 2022-11.41%-10.70%

Both funds faced challenges in the second quarter of 2022, reflecting the market’s volatility.

Maximum Drawdown

Now, let’s delve into the Maximum Drawdown, a crucial metric indicating the potential risk and loss magnitude:

3-Year Analysis

MetricSBI Contra FundParag Parikh Flexi Cap FundCategory
3-Year-5.98-14.01-13.07

The 3-year Maximum Drawdown numbers reveal the extent of potential losses during this period. While both funds faced downturns, Parag Parikh Flexi Cap Fund experienced a deeper drawdown.

5-Year Analysis

MetricSBI Contra FundParag Parikh Flexi Cap FundCategory
5-Year-31.9-23.13-36.21

In the 5-year category, both funds navigated downturns reasonably well, with SBI Contra Fund showing resilience with a slightly lower drawdown.

10-Year Analysis

MetricSBI Contra FundParag Parikh Flexi Cap FundCategory
10-Year-38.04-23.13-41.53

Over the ten years, both funds demonstrated resilience, but the SBI Contra Fund showcased a lower drawdown than the Parag Parikh Flexi Cap Fund.

Understanding the nuances of mutual funds is like deciphering a complex code. In this journey, risk analysis plays a pivotal role. Analyzing the best and worst quarters and the Maximum Drawdown provides investors valuable insights to make informed decisions.

For investors, understanding mutual funds’ annualized and quarterly results is akin to reading the weather forecast before setting sail. Over the years, we’ll delve into the performance of two notable funds – SBI Contra Fund and Parag Parikh Flexi Cap Fund – to provide insights that could guide investors in making informed decisions.

Annualized Results (NAV as of October 30, 2023)

Annualized returns are a barometer of a fund’s performance over various periods. Let’s take a closer look at the returns of the SBI Contra Fund, Parag Parikh Flexi Cap Fund, and the Nifty 50 from 2016 to 2023:

PeriodSBI Contra FundParag Parikh Flexi Cap FundNifty 50
202319.70%22.89%4.85%
202213.63%-6.29%3.24%
202149.11%45.52%23.79%
202030.61%33.99%14.77%
2019-0.34%15.48%11.53%
2018-13.55%0.22%4.09%
201741.06%30.10%27.58%
20162.40%4.11%2.72%

Outperformance Analysis

Understanding how often a fund outperforms its benchmark or peers is crucial. Here’s a comparative analysis of the SBI Contra Fund and Parag Parikh Flexi Cap Fund:

OutperformanceSBI Contra FundParag Parikh Flexi Cap Fund
No. Of Times35

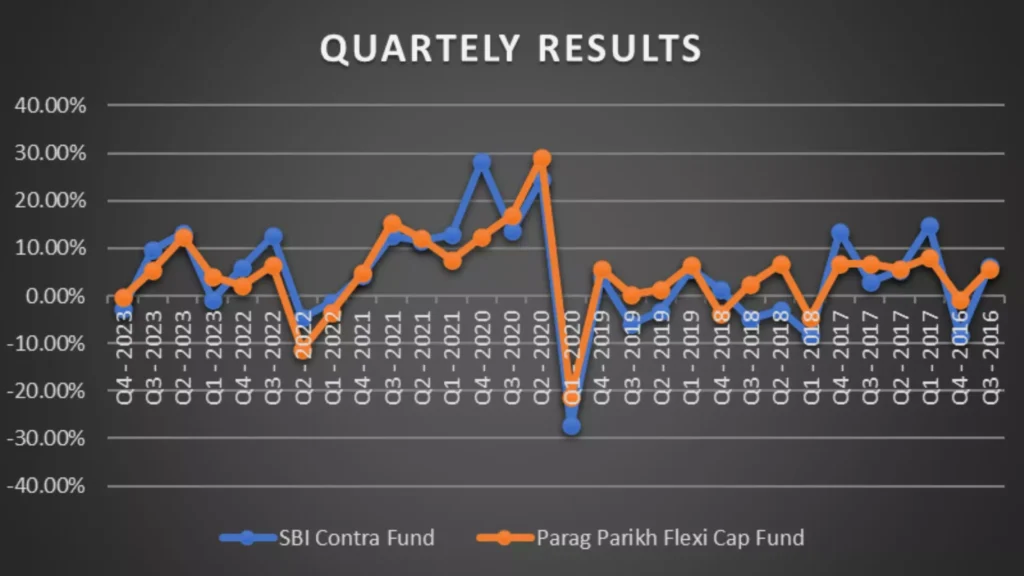
Quarterly Results (NAV as of October 30, 2023)

Quarterly results offer a more granular view, helping investors adapt to the ever-changing market conditions. Let’s explore the quarterly performance of both funds and the Nifty 50:

PeriodSBI Contra FundParag Parikh Flexi Cap FundNifty 50
Q4 – 2023-2.71%-0.20%-2.30%
Q3 – 20239.62%5.38%1.07%
Q2 – 202313.20%12.41%10.29%
Q1 – 2023-0.85%3.95%-4.60%
Q4 – 20225.81%2.29%7.76%
Q3 – 202212.55%6.59%8.52%
Q2 – 2022-4.56%-11.41%-10.70%
Q1 – 2022-1.33%-3.57%-0.91%
Q4 – 20214.34%4.75%-1.02%
Q3 – 202112.60%15.31%12.36%
Q2 – 202111.53%12.23%5.75%
Q1 – 202112.90%7.60%4.80%
Q4 – 202028.29%12.35%22.46%
Q3 – 202013.62%16.88%7.84%
Q2 – 202024.40%29.08%24.82%
Q1 – 2020-27.27%-21.38%-29.43%
Q4 – 20194.12%5.77%7.12%
Q3 – 2019-5.83%0.35%-3.30%
Q2 – 2019-3.34%1.44%1.68%
Q1 – 20195.79%6.58%6.96%
Q4 – 20181.45%-3.82%-1.32%
Q3 – 2018-4.96%2.46%3.29%
Q2 – 2018-2.84%6.83%4.36%
Q1 – 2018-8.32%-4.49%-2.14%
Q4 – 201713.36%6.76%5.84%
Q3 – 20172.96%6.86%2.54%
Q2 – 20175.31%5.58%3.06%
Q1 – 201714.77%8.01%12.16%
Q4 – 2016-8.33%-0.78%-6.39%
Q3 – 20166.23%5.78%3.40%

Outperformance Analysis

Understanding how often a fund outperforms its benchmark or peers is crucial. Here’s a comparative analysis of the SBI Contra Fund and Parag Parikh Flexi Cap Fund in the quarterly context:

OutperformanceSBI Contra FundParag Parikh Flexi Cap Fund
No. Of Times1218

Deciphering the numbers is like reading the language of the market. While annualized results give us a bird’s-eye view, quarterly results unveil the nuances. SBI Contra Fund and Parag Parikh Flexi Cap Fund have unique rhythms in sync with the market’s melody.

Now, we’ll delve into the risk metrics and sector allocations of two prominent funds, SBI Contra Fund and Parag Parikh Flexi Cap Fund, aiming to provide investors with a compass for their investment journey.

Risk Analysis

Understanding the risk associated with a fund is paramount. Let’s look at the risk metrics for both funds:

FundMean Return (%)Std Dev (%)Sharpe (%)Sortino (%)Beta (%)Alpha (%)
SBI Contra Fund33.2714.561.973.860.8915.45
Parag Parikh Flexi Cap Fund22.7111.651.562.250.647.53

Interpreting the Numbers

  • Mean Return (%): Reflects the average Return, providing an overview of historical performance.
  • Std Dev (%): Indicates the volatility of returns, showcasing the fund’s stability or unpredictability.
  • Sharpe (%): Measures risk-adjusted performance, helping investors gauge returns concerning the risk taken.
  • Sortino (%): Similar to the Sharpe ratio but focuses on downside risk, providing insights into the fund’s resilience.
  • Beta (%): Represents the fund’s sensitivity to market movements.
  • Alpha (%): Gauges a fund manager’s ability to outperform the market.

Understanding these metrics is like deciphering a map, helping investors navigate the complex landscape of investment risks.

Sector Allocation

Sector allocation is a vital aspect of a fund’s strategy. Let’s explore how SBI Contra Fund and Parag Parikh Flexi Cap Fund allocate their resources across different sectors:

SectorSBI Contra Fund (%)Parag Parikh Flexi Cap Fund portfolio (%)
Financial21.7530
Energy14.104.93
Technology7.3111.67
Metals & Mining6.632.14
Healthcare6.583.68
Automobile6.166.73
Services6.0114.66
Materials4.774.98
Capital Goods3.55NA
Consumer Staples3.356.30
Chemicals2.99NA
Construction1.52NA
Consumer Discretionary0.94NA
Communication0.89NA
Insurance0.63NA
Textiles0.60NA

Analyzing Sector Exposure

  • Financials hold significant weight in both funds, but Parag Parikh Flexi Cap Fund allocates a more substantial percentage to this sector.
  • Technology is more pronounced in the Parag Parikh Flexi Cap Fund.
  • Services have a higher allocation in the Parag Parikh Flexi Cap Fund, suggesting a diverse approach.

Investing isn’t just about returns; it’s about understanding the journey and the potential hurdles. SBI Contra Fund and Parag Parikh Flexi Cap Fund navigate the markets differently, offering investors unique routes to possible success. By comprehending risk metrics and sector allocations, investors can better equip themselves for the twists and turns of the investment voyage.

Crisil Rank: A Consistent 5-Star Performance

(Updated on September 30, 2023)

Crisil RankSBI Contra FundParag Parikh Flexi Cap Fund
Sep 20235 StarNA
Jun 20235 StarNA
Mar 20235 StarNA
Dec 20225 StarNA
Sep 20225 StarNA

Value Research Rating: Equally Outstanding

Value Research RatingSBI Contra FundParag Parikh Flexi Cap Fund
5 Star5 Star

Morning Star Rating: Varied Recognition

Morning Star RatingSBI Contra FundParag Parikh Flexi Cap Fund
NA5 Star

Portfolio Overlapping Comparison: Striking Differences

Portfolio Overlap Total (%)SBI Contra FundParag Parikh Flexi Cap Fund
19.5641.5

Portfolio Comparison: Diverse Asset Allocation

Portfolio CompositionSBI Contra FundParag Parikh Flexi Cap Fund Portfolio
Equity (82.52%)Equity (86.68%)
Debt (7.26%)Debt (0.43%)
Others (10.22%)Others (12.89%)

Market Cap Allocation: Balancing the Investment Landscape

Market Cap AllocationSBI Contra FundParag Parikh Flexi Cap Fund Portfolio
No of Stocks87 (Category Avg – 71.00)40 (Category Avg – 56.22)
Large Cap Investments35.23%49.94%
Mid Cap Investments17.69%4.77%
Small Cap Investments11.10%6.33%

Fund Management Comparison: Skilled Leadership Over Years

SBI Contra Fund Management:

  • Mohit Jain: May 05, 2018 – till date (5 Yrs 5 Months)
  • Dinesh Balachandran: May 07, 2018 – till date (5 Yrs 5 Months)

Parag Parikh Flexi Cap Fund Management:

  • Rajeev Thakkar: May 24, 2013 – till date (10 Yrs 5 Months)
  • Raunak Onkar: May 24, 2013 – till date (10 Yrs 5 Months)
  • Raj Mehta: Jan 27, 2016 – till date (7 Yrs 10 Months)
  • Rukun Tarachandani: May 16, 2022 – till date (1 Yrs 5 Months)

In the world of mutual funds, every detail matters. From star ratings to portfolio composition and fund management teams, each element contributes to the overall investment experience. While sharing a few similarities, the SBI Contra Fund and Parag Parikh Flexi Cap Fund exhibit distinct characteristics. The choice ultimately depends on your risk appetite, investment goals, and the story you want your portfolio to tell.

Conclusion: Navigating Investment Horizons

In conclusion, the comparative Analysis of SBI Contra Fund and Parag Parikh Flexi Cap Fund paints a nuanced picture of their performance across various parameters. SBI Contra Fund has consistently demonstrated higher annualized returns, outperforming Parag Parikh Flexi Cap Fund in short- and long-term periods. However, when considering risk metrics and a more balanced sectoral allocation, the Parag Parikh Flexi Cap Fund emerges as a resilient choice. Parag Parikh Flexi Cap Fund may be the preferred option for investors seeking stability and a more diversified approach. Ultimately, the alternative between the two funds depends on individual risk appetites and investment goals, and consulting with a financial advisor is recommended for personalized guidance.

Mutual fund investments are subject to market risks, and past performance does not indicate future results. Before embarking on your investment journey, consult a financial advisor to tailor your choices to your unique financial needs. May your investment voyage be both prosperous and fulfilling!

Frequently Asked Questions (FAQs) – SBI Contra Fund vs Parag Parikh Flexi Cap Fund

Q1: Which Fund Has a Better Performance Track Record?

A: SBI Contra Fund and Parag Parikh Flexi Cap Fund both boast impressive track records, with SBI Contra Fund exhibiting consistently high annualized returns across various time frames. However, the choice should align with your investment goals and risk tolerance.

Q2: How Do the Crisil Ranks Differ Between the Funds?

A: SBI Contra Fund consistently holds a 5-star Crisil rank, showcasing its sustained excellence. Parag Parikh Flexi Cap Fund, although not rated recently, has historically secured a 5-star rank.

Q3: What Are the Key Differences in Portfolio Overlap?

A: SBI Contra Fund has a lower portfolio overlap (19.56%) than Parag Parikh Flexi Cap Fund (41.5%). Parag Parikh Flexi Cap Fund may have a more diversified portfolio.

Q4: How Do the Funds Differ in Terms of Market Cap Allocation?

A: Both funds differ in their market cap allocations. SBI Contra Fund leans towards a higher proportion of mid-cap investments, while Parag Parikh Flexi Cap Fund focuses more on large-cap investments.

Q5: Which Fund Has a More Diverse Sector Allocation?

A: Parag Parikh Flexi Cap Fund showcases a broader sector allocation, especially in technology, services, and consumer staples. SBI Contra Fund, while diverse, has a slightly more concentrated sector allocation.

Q6: Who Are the Fund Managers, and How Experienced Are They?

A: SBI Contra Fund is managed by Mohit Jain and Dinesh Balachandran, with over five years of experience. Parag Parikh Flexi Cap Fund is overseen by a seasoned team with over ten years of experience, including Rajeev Thakkar.

Q7: Are These Funds Suitable for Long-Term Investments?

A: Both funds are suitable for long-term investments. SBI Contra Fund has demonstrated stability over the years, while Parag Parikh Flexi Cap Fund offers a diversified approach to long-term growth.

Q8: How Often do Value Research and Morning Star rate these Funds?

A: Both funds consistently receive 5-star ratings from Value Research. While SBI Contra Fund lacks a Morning Star rating, Parag Parikh Flexi Cap Fund proudly holds a 5-star recognition.

Q9: What Is the Risk Analysis of SBI Contra Fund and Parag Parikh Flexi Cap Fund?

A: SBI Contra Fund has a higher mean return, slightly higher standard deviation, and a better Sharpe and Sortino ratio than Parag Parikh Flexi Cap Fund. It indicates potentially higher returns for a slightly higher risk.

Q10: Any Recommendations Before Investing in These Funds?

A: Before investing, assess your financial goals, risk tolerance, and investment horizon. It’s advisable to consult with a financial advisor to tailor your investment strategy to your specific needs and market conditions.

Q11: How Do the Funds Perform During Specific Quarters?

A: Both funds showcase varying performances in different quarters. For example, SBI Contra Fund had a remarkable 28.29% return in Q4 – 2020, while Parag Parikh Flexi Cap Fund outperformed in Q2 – 2020 with a 29.08% return.

Q12: What Are the Worst Performances of These Funds in Specific Quarters?

A: During Q1 – 2018, SBI Contra Fund experienced a -8.32% return, while Parag Parikh Flexi Cap Fund had a -4.49% return. Understanding the worst-performing quarters is crucial for risk assessment.

Q13: How Do SIP Returns Differ Between the SBI Contra Fund and Parag Parikh Flexi Cap Fund?

A: SIP returns vary across different periods. SBI Contra Fund has shown consistently higher SIP returns than Parag Parikh Flexi Cap Fund, emphasizing its potential for systematic investment.

Q14: What Is the Historical Lumpsum Investment Value of These Funds?

A: Analyzing the lumpsum investment values over various periods reveals that both funds have grown substantially. For instance, SBI Contra Fund’s 10-year lumpsum value is 52314.3.

Q15: Can You Summarize the Comparative Performance of These Funds?

A: In a category-wise comparison, SBI Contra Fund consistently outperforms Parag Parikh Flexi Cap Fund and Nifty 50 across various time frames, indicating its strong performance in the market.

Q16: What Is the Maximum Drawdown for Both Funds?

A: The maximum drawdown for SBI Contra Fund over 3, 5, and 10 years is comparatively lower than that of Parag Parikh Flexi Cap Fund and the category average, highlighting its resilience during market downturns.

Q17: How Do the Funds Allocate Investments Across Sectors?

A: The sector allocation table reveals the percentage of assets invested in different sectors. For example, Parag Parikh Flexi Cap Fund has a notable allocation in technology, services, and consumer staples.

Q18: Is There a Significant Difference in the Fund Managers’ Experience?

A: While both funds have experienced fund managers, SBI Contra Fund managers have been in their roles for over five years, whereas Parag Parikh Flexi Cap Fund has a mix of long-term and relatively newer managers.

Q19: How Does the Alpha of These Funds Compare?

A: SBI Contra Fund exhibits a higher alpha, indicating its ability to generate excess returns. Alpha measures a fund’s performance relative to its benchmark, showcasing SBI Contra Fund’s potential for positive abnormal returns.

Q20: Any Notable Changes in Fund Management Teams Over the Last Decade?

A: Parag Parikh Flexi Cap Fund has seen a recent addition to its management team in Rukun Tarachandani in May 2022, adding a new dimension to the fund’s expertise.

Always stay informed about the latest developments, market trends, and fund-specific news to make well-informed investment decisions.

Disclaimer:

This blog is solely for educational purposes. The securities/investments quoted here are not recommendatory. This is not an investment advisory. The blog is for information purposes only. Investments in the securities market are subject to market risks. Read all the related documents carefully before investing.

Past performance is not indicative of future returns. Please consider your specific investment requirements, risk tolerance, goal, time frame, risk and reward balance, and the cost associated with the investment before choosing a fund or designing a portfolio that suits your needs. The performance and returns of any investment portfolio can neither be predicted nor guaranteed. 

The information provided in this article is solely the author/advertisers’ opinion and not investment advice – it is provided for educational purposes only. Using this, you agree that the information does not constitute any investment or financial instructions by Ace Equity Research and the team. Anyone wishing to invest should seek their own independent financial or professional advice. Do conduct your research along with registered financial advisors before making any investment decisions. Ace Equity Research and the team are not accountable for the investment views provided in the article.

Leave a Comment

Your email address will not be published. Required fields are marked *

error: Content is protected !!
Scroll to Top