In the fast-paced world of investments, choosing the right index fund is crucial for long-term financial success. Two giants in the market, UTI Nifty 50 Index Fund and ICICI Prudential Nifty 50 Index Fund, vie for investors’ attention. In this detailed comparative Analysis, we’ll dive into various aspects, dissecting their investment objectives, historical performance, and more to help you make an informed decision. The table below presents the returns of various active large-cap mutual funds over different timeframes:
Scheme Name
1Y
2Y
3Y
5Y
Nippon India Large Cap Fund
8.69%
36.35%
17.46%
12.43%
HDFC Top 100 Fund
6.85%
32.34%
15.35%
10.77%
ICICI Prudential Bluechip Fund
4.95%
29.74%
17.78%
12.47%
Taurus Largecap Equity Fund
3.55%
21.69%
12.82%
8.09%
JM Large Cap Fund
2.75%
21.34%
16.26%
10.95%
SBI Blue Chip Fund
2.70%
28.16%
16.67%
12.07%
Baroda BNP Paribas Large Cap Fund
2.59%
24.76%
16.25%
12.94%
IDBI India Top 100 Equity Fund
2.51%
28.34%
18.58%
12.75%
Edelweiss Large Cap Fund
2.50%
24.87%
16.77%
13.18%
ICICI Prudential Nifty 50 Index Fund
2.36%
25.98%
16.10%
12.64%
UTI Nifty 50 Index Fund
2.35%
26.06%
16.12%
12.78%
L&T India Large Cap Fund
2.02%
24.83%
15.06%
11.53%
Aditya Birla Sun Life Frontline Equity Fund
1.33%
27.45%
16.42%
10.82%
Tata Large Cap Fund
1.29%
28.84%
15.42%
11.52%
DSP Top 100 Equity Fund
1.24%
21.78%
11.57%
9.25%
Kotak Bluechip Fund
1.15%
25.98%
17.59%
13.09%
Indiabulls Bluechip Fund
1.02%
22.19%
12.28%
10.05%
Canara Robeco Bluechip Equity Fund
0.93%
24.81%
18.85%
15.34%
HSBC Large Cap Equity Fund
0.68%
23.36%
15.10%
11.28%
Mirae Asset Large Cap Fund
0.63%
25.19%
16.03%
12.41%
PGIM India Large Cap Fund
0.39%
22.27%
14.00%
10.67%
IDFC Large Cap Fund
-0.45%
22.46%
16.12%
11.14%
UTI Master shared Unit Scheme
-0.49%
26.22%
17.63%
12.90%
LIC MF Large Cap Fund
-1.39%
23.86%
14.46%
11.68%
Union Largecap Fund
-1.90%
24.90%
15.50%
10.49%
Invesco India Largecap Fund
-1.90%
24.71%
16.79%
12.60%
DSP Flexi Cap Fund
-4.00%
25.78%
16.59%
12.62%
Franklin India Bluechip Fund
-4.57%
27.01%
15.76%
9.54%
Axis Bluechip Fund
-5.03%
19.70%
13.82%
14.02%
Breaking Down the Numbers: UTI Nifty 50 Index Fund vs. ICICI Prudential Nifty 50 Index Fund
1-Year performance:
UTI Nifty 50 Index Fund and ICICI Prudential Nifty 50 Index Fund exhibited commendable performance over the last year. UTI Nifty 50 Index Fund slightly edges ahead with a return of 2.35%. In comparison, ICICI Prudential Nifty 50 Index Fund follows closely with a return of 2.36%. These figures position both index funds competitively against actively managed large-cap funds.
2-Year performance:
Over the 2-year horizon, both index funds continue to demonstrate stability and competitive returns. UTI Nifty 50 Index Fund records a return of 26.06%, marginally outpacing ICICI Prudential Nifty 50 Index Fund, which stands at 25.98%. This consistency is a testament to the reliability of index funds in delivering steady returns.
3-Year performance:
Looking at the 3-year Performance, UTI Nifty 50 Index Fund maintains its lead with a return of 16.12%. In comparison, ICICI Prudential Nifty 50 Index Fund closely follows at 16.10%. The relatively close figures indicate sustained performance over the mid-term, reinforcing the stability of these index funds.
5-Year performance:
Expanding the horizon to 5 years, both funds exhibit consistent returns. UTI Nifty 50 Index Fund records a return of 12.78%, while ICICI Prudential Nifty 50 Index Fund stands at 12.64%. The minimal variance underscores the long-term reliability of these index funds compared to actively managed alternatives.
Investment Objectives: Deciphering the Essence
UTI Nifty 50 Index Fund
UTI Nifty 50 Index Fund sets out with a clear mission: actively invest in stocks mirroring the Nifty 50 Index. The goal is to achieve returns equivalent to the Nifty 50 Index through passive investment. However, it’s important to note that, as with any investment, there’s no guaranteed assurance of achieving this objective.
ICICI Prudential Nifty 50 Index Fund
Conversely, ICICI Prudential Nifty 50 Index Fund operates as an open-ended index-linked growth scheme. Its primary aim is to track the returns of the CNX Nifty by investing in a basket of stocks from the index constituents. The fund seeks to closely mirror the Performance of the CNX Nifty without aiming to outperform or underperform it.
Analysis: Both funds share a common goal of tracking Nifty 50 but differ slightly in their approach. UTI Nifty 50 Index Fund emphasizes “passive” investment. In comparison, ICICI Prudential Nifty 50 Index Fund focuses on closely tracking CNX Nifty without attempting to outshine it.
Performance Analysis: Unveiling the Numbers
Let’s unravel the historical performance of these funds over various timeframes.
1-Year performance
UTI Nifty 50 Index Fund: 2.35%
ICICI Prudential Nifty 50 Index Fund: 2.36%
Both funds exhibit remarkably similar returns in the short term, with only a marginal difference.
2-Year performance
UTI Nifty 50 Index Fund: 26.06%
ICICI Prudential Nifty 50 Index Fund: 25.98%
Over a two-year horizon, again, the performance gap remains minimal.
3-Year performance
UTI Nifty 50 Index Fund: 16.12%
ICICI Prudential Nifty 50 Index Fund: 16.10%
Consistency is the key, and these funds continue to shadow each other’s performance closely.
5-Year performance
UTI Nifty 50 Index Fund: 12.78%
ICICI Prudential Nifty 50 Index Fund: 12.64%
Even over a more extended period, the difference in returns is negligible.
Analysis: The performance numbers show striking similarity, emphasizing that both funds have consistently delivered returns over various timeframes.
Scheme Comparison: Peer Group Analysis
For a holistic perspective, let’s compare the Performance of UTI Nifty 50 Index Fund and ICICI Prudential Nifty 50 Index Fund with other popular large-cap funds.
Scheme Name
1Y
2Y
3Y
5Y
Nippon India Large Cap Fund
8.69%
36.35%
17.46%
12.43%
HDFC Top 100 Fund
6.85%
32.34%
15.35%
10.77%
ICICI Prudential Nifty 50 Index Fund
2.36%
25.98%
16.10%
12.64%
UTI Nifty 50 Index Fund
2.35%
26.06%
16.12%
12.78%
Analysis: UTI Nifty 50 Index Fund and ICICI Prudential Nifty 50 Index Fund consistently hold their ground against other large-cap funds, demonstrating competitive performance across the board.
Understanding Discrete Fund Returns
Performance Snapshot (as of 03-11-2022)
Let’s briefly glance at the discrete fund returns for both funds from December 2014 to December 2021 and the year-to-date (YTD) figures.
Fund
03-11-2022
Dec’ 14
Dec’ 15
Dec’ 16
Dec’ 17
Dec’ 18
Dec’ 19
Dec’ 20
Dec’ 21
UTI Nifty 50 Index Fund
31.76
-3.35
4.01
29.69
4.26
14.05
14.68
25.2
5.61
ICICI Prudential Nifty 50 Index Fund
32.48
-3.63
3.56
28.73
3.37
12.84
15.21
24.88
5.45
Analysis: The returns seem to dance closely, showcasing a competitive spirit between the two funds.
Year-to-Date (YTD) Snapshot
Now, let’s look at the most recent performances in 2022.
Fund
2022
UTI Nifty 50 Index Fund
5.7
ICICI Prudential Nifty 50 Index Fund
5.65
Analysis: Neck and neck! The year is young, but both funds are off to a promising start.
Direct vs. Regular Analysis
Performance Comparison (as of 03-11-2022)
Now, let’s put the funds head-to-head for a more granular view.
Fund
03-11-2022
Dec’ 14
Dec’ 15
Dec’ 16
Dec’ 17
Dec’ 18
Dec’ 19
Dec’ 20
Dec’ 21
UTI Nifty 50 Index Fund
31.76
-3.35
4.01
29.69
4.26
14.05
14.68
25.2
5.61
UTI Nifty 50 Index Fund (Dir.)
32.02
-3.22
4.1
29.79
4.33
14.14
14.74
25.31
5.7
ICICI Prudential Nifty 50 Index Fund
32.48
-3.63
3.56
28.73
3.37
12.84
15.21
24.88
5.45
ICICI Prudential Nifty 50 Index Fund (Dir.)
32.99
-3.24
3.98
29.15
3.82
13.29
15.65
25.24
5.65
Analysis: Whether direct or regular, both funds march to the same rhythm, proving consistency.
Cracking the CAGR Code
Compound Annual Growth Rate (CAGR) Analysis (as of 03-11-2022)
Now, let’s unravel the compound annual growth rates for funds over five years, three years, and one year.
Fund
5-Year
3-Year
1-Year
UTI Nifty 50 Index Fund
12.85
15.88
3.07
ICICI Prudential Nifty 50 Index Fund
12.71
15.87
3.06
Analysis: The growth rates mirror each other, showcasing a robust performance from both funds.
Ave. Rolling Returns: A Closer Look
Average Rolling Returns Analysis (as of 03-11-2022)
Digging deeper, let’s explore the average rolling returns over five years, three years, and one year.
Fund
5-Year
3-Year
1-Year
UTI Nifty 50 Index Fund
12.01
11.69
15.15
ICICI Prudential Nifty 50 Index Fund
11.84
11.58
15.17
Analysis: The average returns tell a story of consistent Performance over various timeframes for both funds.
Lumpsum Returns: Unveiling the Numbers
Lumpsum Returns Analysis (as of 03-11-2022)
Let’s explore the lumpsum returns over five years, three years, two years, and one year.
Fund
5-Year
3-Year
2-Year
1-Year
UTI Nifty 50 Index Fund
18254.6
15662
15910.6
10235.4
ICICI Prudential Nifty 50 Index Fund
18138.7
15657.6
15890.7
10235.8
Analysis: Lumpsum investors have seen substantial gains, with both funds delivering commendable returns.
SIP Returns: Sip and Savor the Numbers
SIP Returns Analysis (as of 03-11-2022)
Finally, let’s delve into SIP returns over five years, three years, two years, and one year.
Fund
5-Year
3-Year
2-Year
1-Year
UTI Nifty 50 Index Fund
90047.34
48617.98
27829.04
12809.89
ICICI Prudential Nifty 50 Index Fund
89916.87
48578.21
27819.94
12808.37
Analysis: Systematic Investment Plan (SIP) investors have reason to smile, as both funds present attractive returns over various investment horizons.
Unveiling Expense Ratios
Regular Expense Ratios (as of 03-11-2022)
Let’s dive into the expense ratios for both funds, dissecting the figures from December 2014 to December 2021, including the year-to-date (YTD) values.
Fund
03-11-2022
Dec’ 14
Dec’ 15
Dec’ 16
Dec’ 17
Dec’ 18
Dec’ 19
Dec’ 20
Dec’ 21
UTI Nifty 50 Index Fund (Reg.)
1.06
0.21
0.2
0.2
0.2
0.17
0.14
0.3
0.3
ICICI Prudential Nifty 50 Index Fund (Reg.)
0.57
0.57
0.94
0.94
0.75
0.45
0.45
0.4
0.4
Analysis: Regular expense ratios reveal the cost of managing these funds. UTI Nifty 50 Index Fund has a slightly higher expense ratio than ICICI Prudential Nifty 50 Index Fund.
Direct Expense Ratios (as of 03-11-2022)
Now, let’s focus on the direct expense ratios for both funds during the same time frame.
Fund
03-11-2022
Dec’ 14
Dec’ 15
Dec’ 16
Dec’ 17
Dec’ 18
Dec’ 19
Dec’ 20
Dec’ 21
UTI Nifty 50 Index Fund (Dir.)
0.11
0.11
0.11
0.13
0.13
0.1
0.1
0.2
0.2
ICICI Prudential Nifty 50 Index Fund (Dir.)
0.4
0.4
0.48
0.53
0.32
0.1
0.1
0.17
0.17
Analysis: Direct expense ratios paint a different picture. UTI Nifty 50 Index Fund boasts lower direct expense ratios than its counterpart.
Analyzing Expense Ratios: A Deeper Dive
Comparative Analysis (as of 03-11-2022)
Now, let’s present a side-by-side comparison of regular and direct expense ratios for both funds.
Fund
Type
03-11-2022
Dec’ 14
Dec’ 15
Dec’ 16
Dec’ 17
Dec’ 18
Dec’ 19
Dec’ 20
Dec’ 21
UTI Nifty 50 Index Fund
Regular
1.06
0.21
0.2
0.2
0.2
0.17
0.14
0.3
0.3
UTI Nifty 50 Index Fund
Direct
0.11
0.11
0.11
0.13
0.13
0.1
0.1
0.2
0.2
ICICI Prudential Nifty 50 Index Fund
Regular
0.57
0.57
0.94
0.94
0.75
0.45
0.45
0.4
0.4
ICICI Prudential Nifty 50 Index Fund
Direct
0.4
0.4
0.48
0.53
0.32
0.1
0.1
0.17
0.17
Analysis: The table above puts the regular and direct expense ratios face-to-face. UTI Nifty 50 Index Fund shows a notable difference in the two expense ratios. ICICI Prudential Nifty 50 Index Fund maintains a more consistent margin.
Risk Analysis:
Mean Return: Who Takes the Lead?
Regular Mean Return (%)
Let’s start our Analysis with the mean returns for both funds as of 03-11-2022.
Metric
Fund
UTI Nifty 50 Index Fund
ICICI Prudential Nifty 50 Index Fund
Conclusion
Regular Mean Return (%)
Higher Is Better
17.32
17.05
UTI Nifty 50 Index Fund shows a slightly higher regular mean return.
Direct Mean Return (%)
Let’s delve into the direct mean returns for a more comprehensive comparison.
Metric
Fund
UTI Nifty 50 Index Fund
ICICI Prudential Nifty 50 Index Fund
Conclusion
Direct Mean Return (%)
Higher Is Better
17.40
17.36
UTI Nifty 50 Index Fund maintains a lead in direct mean returns.
Sharpe Ratio: Gauging Risk-Adjusted Performance
Regular Sharpe Ratio (%)
Moving on, we examine the Sharpe ratios for both funds as of 03-11-2022.
Metric
Fund
UTI Nifty 50 Index Fund
ICICI Prudential Nifty 50 Index Fund
Conclusion
Regular Sharpe Ratio (%)
Higher Is Better
0.61
0.60
UTI Nifty 50 Index Fund exhibits a marginally higher regular Sharpe ratio.
Direct Sharpe Ratio (%)
Digging deeper, let’s explore the direct Sharpe ratios for a nuanced understanding.
Metric
Fund
UTI Nifty 50 Index Fund
ICICI Prudential Nifty 50 Index Fund
Conclusion
Direct Sharpe Ratio (%)
Higher Is Better
0.62
0.62
The direct Sharpe ratios for both funds are evenly matched—no clear winner in this category.
Sortino Ratio: A Tale of Downside Risk
Regular Sortino Ratio (%)
Delving into downside risk, we scrutinize the regular Sortino ratios.
Metric
Fund
UTI Nifty 50 Index Fund
ICICI Prudential Nifty 50 Index Fund
Conclusion
Regular Sortino Ratio (%)
Higher Is Better
0.74
0.73
UTI Nifty 50 Index Fund edges ahead with a higher regular Sortino ratio.
Direct Sortino Ratio (%)
A closer look at the direct Sortino ratios brings forth additional insights.
Metric
Fund
UTI Nifty 50 Index Fund
ICICI Prudential Nifty 50 Index Fund
Conclusion
Direct Sortino Ratio (%)
Higher Is Better
0.74
0.75
ICICI Prudential Nifty 50 Index Fund takes the lead in direct Sortino ratios.
Alpha: Benchmarking Excess Returns
Regular Alpha (%)
Benchmarking against a standard, we scrutinize the regular alpha values.
Metric
Fund
UTI Nifty 50 Index Fund
ICICI Prudential Nifty 50 Index Fund
Conclusion
Regular Alpha (%)
Higher Is Better
-0.95
-1.16
UTI Nifty 50 Index Fund displays a higher regular alpha, indicating potential for excess returns.
Direct Alpha (%)
Our Analysis extends to direct alpha values for a more comprehensive understanding.
Metric
Fund
UTI Nifty 50 Index Fund
ICICI Prudential Nifty 50 Index Fund
Conclusion
Direct Alpha (%)
Higher Is Better
-0.87
-0.85
In the domain of direct Alpha, UTI Nifty 50 Index Fund retains a marginal lead.
Treynor’s Ratio: Balancing Returns with Systematic Risk
Regular Treynor’s Ratio
Balancing returns with systematic risk, we evaluate regular Treynor’s ratios.
Metric
Fund
UTI Nifty 50 Index Fund
ICICI Prudential Nifty 50 Index Fund
Conclusion
Regular Treynor’s Ratio
Higher Is Better
0.11
0.11
The regular Treynor’s ratios for both funds are evenly matched—no clear winner in this category.
Direct Treynor’s Ratio
Our exploration extends to direct Treynor’s ratios for a more nuanced assessment.
Metric
Fund
UTI Nifty 50 Index Fund
ICICI Prudential Nifty 50 Index Fund
Conclusion
Direct Treynor’s Ratio
Higher Is Better
0.11
0.11
Both funds exhibit identical direct Treynor’s ratios, showcasing a balanced performance.
Standard Deviation: Unveiling Volatility
Regular Standard Deviation (%)
Unveiling the extent of volatility, we explore regular standard deviation values.
Metric
Fund
UTI Nifty 50 Index Fund
ICICI Prudential Nifty 50 Index Fund
Conclusion
Regular Standard Deviation (%)
Lower Is Better
22.40
22.30
ICICI Prudential Nifty 50 Index Fund displays a slightly lower regular standard deviation, indicating lower volatility.
Direct Standard Deviation (%)
Our journey through volatility extends to direct standard deviation values.
Metric
Fund
UTI Nifty 50 Index Fund
ICICI Prudential Nifty 50 Index Fund
Conclusion
Direct Standard Deviation (%)
Lower Is Better
22.40
22.30
ICICI Prudential Nifty 50 Index Fund maintains a marginally lower direct standard deviation.
Beta: Gauging Systematic Risk
Regular Beta (%)
Evaluating systematic risk, we explore regular beta values.
Metric
Fund
UTI Nifty 50 Index Fund
ICICI Prudential Nifty 50 Index Fund
Conclusion
Regular Beta (%)
Lower Is Better
1.01
1.00
ICICI Prudential Nifty 50 Index Fund exhibits a marginally lower regular beta, indicating lower systematic risk.
Direct Beta (%)
Our assessment extends to direct beta values for a more comprehensive evaluation.
Metric
Fund
UTI Nifty 50 Index Fund
ICICI Prudential Nifty 50 Index Fund
Conclusion
Direct Beta (%)
Lower Is Better
1.01
1.00
ICICI Prudential Nifty 50 Index Fund maintains a marginally lower direct beta, showcasing lower systematic risk.
Maximum Drawdown: Navigating Peaks and Valleys
Regular Maximum Drawdown (%)
Navigating through peaks and valleys, we scrutinize regular maximum drawdown values.
Metric
Fund
UTI Nifty 50 Index Fund
ICICI Prudential Nifty 50 Index Fund
Conclusion
Regular Maximum Drawdown (%)
Lower Is Better
-29.37
-29.19
ICICI Prudential Nifty 50 Index Fund displays a slightly lower regular maximum drawdown, indicating better resilience during downturns.
Direct Maximum Drawdown (%)
Our journey through market turbulence extends to direct maximum drawdown values.
Metric
Fund
UTI Nifty 50 Index Fund
ICICI Prudential Nifty 50 Index Fund
Conclusion
Direct Maximum Drawdown (%)
Lower Is Better
-29.35
-29.11
ICICI Prudential Nifty 50 Index Fund maintains a marginally lower direct maximum drawdown, showcasing better resilience.
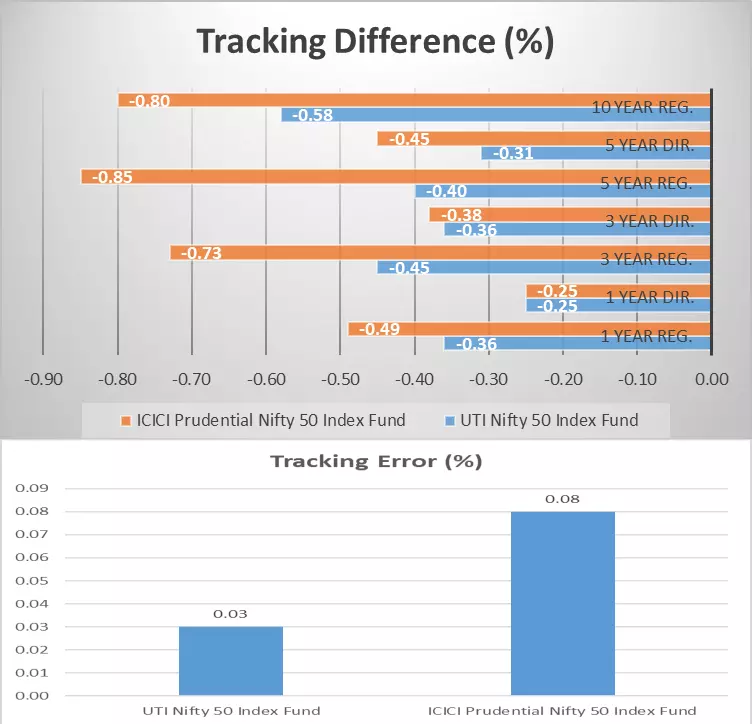
The often overlooked yet crucial parameters of tracking error, tracking difference, and their implications on investment decisions.
Understanding Tracking Error: Precision Matters
Tracking Error (%)
Firstly, let’s demystify tracking error—a metric indicating how closely a fund mirrors its benchmark index. A lower tracking error signifies a closer alignment.
Metric
Fund
UTI Nifty 50 Index Fund
ICICI Prudential Nifty 50 Index Fund
Conclusion
Tracking Error (%)
Lower is Better
0.03
0.08
UTI Nifty 50 Index Fund demonstrates a significantly lower tracking error, showcasing precision mirroring its benchmark.
Decoding Tracking Difference: Bridging the Gap
1-Year Tracking Difference
Now, let’s delve into the tracking difference, an indicator of how closely the fund’s returns align with the index.
Regular 1-Year Tracking Difference
Metric
Fund
UTI Nifty 50 Index Fund
ICICI Prudential Nifty 50 Index Fund
Conclusion
1-Year Reg. Tracking Difference (%)
Lower is Better
-0.36
-0.49
UTI Nifty 50 Index Fund exhibits a lower regular 1-year tracking difference, suggesting closer alignment.
Direct 1-Year Tracking Difference
Metric
Fund
UTI Nifty 50 Index Fund
ICICI Prudential Nifty 50 Index Fund
Conclusion
1-Year Dir. Tracking Difference (%)
Lower is Better
-0.25
-0.25
Both funds showcase identical direct 1-year tracking differences, signalling a balanced performance.
3-Year Tracking Difference
Our Analysis extends to a more comprehensive 3-year tracking difference, offering a broader perspective.
Regular 3-Year Tracking Difference
Metric
Fund
UTI Nifty 50 Index Fund
ICICI Prudential Nifty 50 Index Fund
Conclusion
3-Year Reg. Tracking Difference (%)
Lower is Better
-0.45
-0.73
UTI Nifty 50 Index Fund outshines with a significantly lower regular 3-year tracking difference.
Direct 3-Year Tracking Difference
Metric
Fund
UTI Nifty 50 Index Fund
ICICI Prudential Nifty 50 Index Fund
Conclusion
3-Year Dir. Tracking Difference (%)
Lower is Better
-0.36
-0.38
UTI Nifty 50 Index Fund maintains a lead in direct 3-year tracking difference.
5-Year Tracking Difference
A deeper dive into the 5-year tracking difference provides valuable insights into the funds’ historical performance.
Regular 5-Year Tracking Difference
Metric
Fund
UTI Nifty 50 Index Fund
ICICI Prudential Nifty 50 Index Fund
Conclusion
5-Year Reg. Tracking Difference (%)
Lower is Better
-0.40
-0.85
UTI Nifty 50 Index Fund exhibits a significantly lower regular 5-year tracking difference, indicating a closer alignment.
Direct 5-Year Tracking Difference
Metric
Fund
UTI Nifty 50 Index Fund
ICICI Prudential Nifty 50 Index Fund
Conclusion
5-Year Dir. Tracking Difference (%)
Lower is Better
-0.31
-0.45
UTI Nifty 50 Index Fund maintains a lead in direct 5-year tracking difference.
10-Year Tracking Difference
For a more extended assessment, we explore the 10-year tracking difference—a testament to the funds’ historical consistency.
Regular 10-Year Tracking Difference
Metric
Fund
UTI Nifty 50 Index Fund
ICICI Prudential Nifty 50 Index Fund
Conclusion
10-Year Reg. Tracking Difference (%)
Lower is Better
-0.58
-0.80
UTI Nifty 50 Index Fund displays a significantly lower regular 10-year tracking difference.
Our Verdict:
Our exhaustive Analysis, spanning investment objectives, historical performance, and critical performance indicators, serves as a beacon for those seeking clarity in the crowded financial landscape.
Fund Performance Overview: A Tightly Contested Race
Both funds have exhibited remarkable similarity in their performance over diverse timeframes, with returns dancing closely and consistently shadowing each other. The short-term, mid-term, and long-term performances showcase negligible differences, emphasizing the competitive stance of UTI Nifty 50 Index Fund and ICICI Prudential Nifty 50 Index Fund.
Scheme Comparison: Standing Strong among Peers
Comparing these index funds with other large-cap funds further bolsters their standing. UTI Nifty 50 Index Fund and ICICI Prudential Nifty 50 Index Fund consistently hold their ground against famous peers, proving their mettle in the competitive landscape.
Risk-Adjusted Metrics: A Delicate Balance
Diving into risk-adjusted metrics, the Analysis unfolds a nuanced narrative. UTI Nifty 50 Index Fund edges ahead in specific categories, displaying higher mean returns and Alpha. However, ICICI Prudential Nifty 50 Index Fund shows strength in direct Sortino ratios and maintains a lower regular standard deviation, hinting at lower volatility.
Expense Ratios: A Cost-Benefit Analysis
Expense ratios, a critical consideration for investors, reveal an interesting dynamic. While UTI Nifty 50 Index Fund boasts lower direct expense ratios, ICICI Prudential Nifty 50 Index Fund maintains an edge in regular expense ratios. Investors must weigh this cost-benefit balance based on their preferences and investment horizon.
Tracking Precision: UTI Nifty 50 Index Fund Takes the Lead
In the realm of tracking error and tracking difference, precision matters. UTI Nifty 50 Index Fund emerges as the frontrunner, showcasing a significantly lower tracking error and consistently outperforming in tracking differences across various time frames. This precision mirroring the index positions it as a stalwart in the index fund landscape.
Tailoring Decisions to Risk Appetite: A Personalized Approach
For mutual fund investors with a higher risk tolerance looking for possibly higher returns, UTI Nifty 50 Index Fund stands out, displaying an edge in mean returns, Alpha, and a marginally higher Sharpe ratio. On the other hand, for those valuing lower volatility and downside protection, ICICI Prudential Nifty 50 Index Fund offers an appealing choice with a lower standard deviation and higher direct Sortino ratio.
Conclusion:
In conclusion, the choice between UTI Nifty 50 Index Fund and ICICI Prudential Nifty 50 Index Fund hinges on individual preferences, risk tolerance, and investment goals. While both funds present compelling attributes, the precise tracking and lower tracking error of UTI Nifty 50 Index Fund make it an attractive choice for those seeking a dependable index fund experience. Investors must conduct thorough research, evaluate their risk appetite, and consult with financial professionals before making informed investment decisions custom-made to their unique financial journeys.
Frequently Asked Questions (FAQs) about UTI Nifty 50 Index Fund and ICICI Prudential Nifty 50 Index Fund
What are the expense ratios of UTI Nifty 50 Index Fund and ICICI Prudential Nifty 50 Index Fund?
UTI Nifty 50 Index Fund has slightly higher regular expense ratios than ICICI Prudential Nifty 50 Index Fund. However, the UTI Nifty 50 Index Fund boasts lower values regarding direct expense ratios, indicating a potential cost advantage.
What sets UTI Nifty 50 Index Fund apart regarding tracking precision?
UTI Nifty 50 Index Fund demonstrates superior tracking precision, with a significantly lower tracking error and consistently outperforming ICICI Prudential Nifty 50 Index Fund in tracking differences across various time frames.
How do global economic factors impact the performance of these funds, and should investors consider global market trends?
Global economic factors can influence the performance of these funds, especially given their exposure to large-cap stocks. Investors should stay informed about global market trends, economic indicators, and geopolitical events to make informed decisions aligned with their investment objectives.
Is ICICI Prudential Nifty 50 Index Fund a good investment option?
ICICI Prudential Nifty 50 Index Fund is a reputable index fund that closely tracks the CNX Nifty. Its performance, expense ratios, and risk factors should align with individual investment, financial goals, and risk tolerance. Investors must conduct thorough research or seek financial advice before making investment decisions.
What is UTI Nifty 50 Index Fund, and how does it function?
UTI Nifty 50 Index Fund is an open-ended index fund designed to mirror the performance of the Nifty 50 Index. It invests in a portfolio of stocks replicating the Nifty 50 constituents. The fund aims to provide returns in line with the Nifty 50 Index.
Is UTI Nifty 50 Index Fund a recommended investment choice?
UTI Nifty 50 Index Fund can be a suitable investment for those seeking passive exposure to the Nifty 50 Index. Factors such as historical returns performance, expense ratios, and aligning the fund’s objectives with investor goals should be considered. Prospective investors are encouraged to assess their investment strategy and risk tolerance.
What is the process to invest in UTI Nifty 50 Index Fund?
Investing in UTI Nifty 50 Index Fund involves the following steps: 1. Choose the investment mode: Direct or Regular plan. 2. Open an account with the fund house or a registered distributor. 3. Complete the necessary KYC (Know Your Customer) formalities. 4. Provide the required documents and details. 5. Select the investment amount and mode (lump sum or SIP). 6. Confirm the investment and make the payment.
How frequently does the Nifty 50 Index undergo changes?
The Nifty 50 Index, maintained by the National Stock Exchange (NSE), can change. The index committee typically announces these changes. The frequency of changes depends on factors such as market dynamics, corporate events, and the committee’s periodic reviews.
How does the Nifty 50 Index Fund operate?
Nifty 50 Index Funds operate passively, tracking the Nifty 50 Index. Fund managers invest in a portfolio replicating the Nifty 50 constituents to mirror the index’s performance. Investors in these funds gain exposure to a diversified basket of large-cap stocks that form part of the Nifty 50 Index.
What is the process to purchase UTI Nifty 50 Index Fund?
To buy UTI Nifty 50 Index Fund: 1. Choose between the direct growth and regular plan based on your preference. 2. If you don’t have one, open a trading account with a stockbroker and a demat account. 3. Log in to the stockbroker’s platform. 4. Search for UTI Nifty 50 Index Fund. 5. Place buy orders specifying the investment amount and mode (lump sum or SIP).
Is it advisable to opt for UTI Nifty 50 Index Fund Direct Growth or the Regular Plan?
The choice between UTI Nifty 50 Index Fund Direct-Growth and the Regular Plan depends on investor preferences. The direct plan typically has lower expense ratios, making it cost-effective for investors to make investment decisions independently. The regular plan may involve distributor commissions but could provide advisory support. Investors should evaluate their needs and preferences before deciding.
Disclaimer:
This blog is solely for educational purposes. The securities/investments quoted here are not recommendatory. This is not an investment advisory. The blog is for information purposes only. Investments in the securities market are subject to market risks. Read all the related documents carefully before investing.
Past performance is not indicative of future returns. Please consider your specific investment requirements, risk tolerance, goal, time frame, risk and reward balance, and the cost associated with the investment before choosing a fund or designing a portfolio that suits your needs. The performance and returns of any investment portfolio can neither be predicted nor guaranteed.
The information provided in this article is solely the author/advertisers’ opinion and not investment advice – it is provided for educational purposes only. Using this, you agree that the information does not constitute any investment or financial instructions by Ace Equity Research and the team. Anyone wishing to invest should seek their own independent financial or professional advice. Do conduct your research along with registered financial advisors before making any investment decisions. Ace Equity Research and the team are not accountable for the investment views provided in the article.
Mutual Fund investments are subject to market risks, read all scheme related documents carefully.
Investments in the securities market are subject to market risks, read all the related documents carefully before investing.
S.K. Singh (B.Sc., DHRM, PGDB (Manipal), Ex-Banker (10 years Exp.)), AMFI Reg. No.-251149.
At the helm of Ace Equity Research is our esteemed founder, S.K. Singh. With a solid educational background and years of experience in the field, S.K. Singh brings valuable expertise to our platform.
S.K. Singh's passion for financial markets and dedication to helping investors make informed decisions led him to establish Ace Equity Research. With a deep understanding of the intricacies of the investment landscape, he has a Commitment to Excellence and a Data-Driven Approach to Equity Research.